

By Mark J. Burger, CPA · A case study in the Roth Conversion series · BalancedWealthStrategies.com · As of October 2026
About this illustration. The household below is a hypothetical composite created for education. It is not modeled on any specific client or account, and the figures are generated from a planning model on stated assumptions rather than drawn from any actual person’s finances. It is not a testimonial, not a client endorsement, not a guarantee, and not a representation that any person achieved or will achieve these results. This example is general and educational; it is not relevant to, and should not be relied upon as reflecting, the financial situation, tax bracket, or objectives of any particular reader. Individual outcomes depend on facts, tax law, and market returns, all of which vary and may differ materially from the assumptions used here. See the full disclosures at the end.
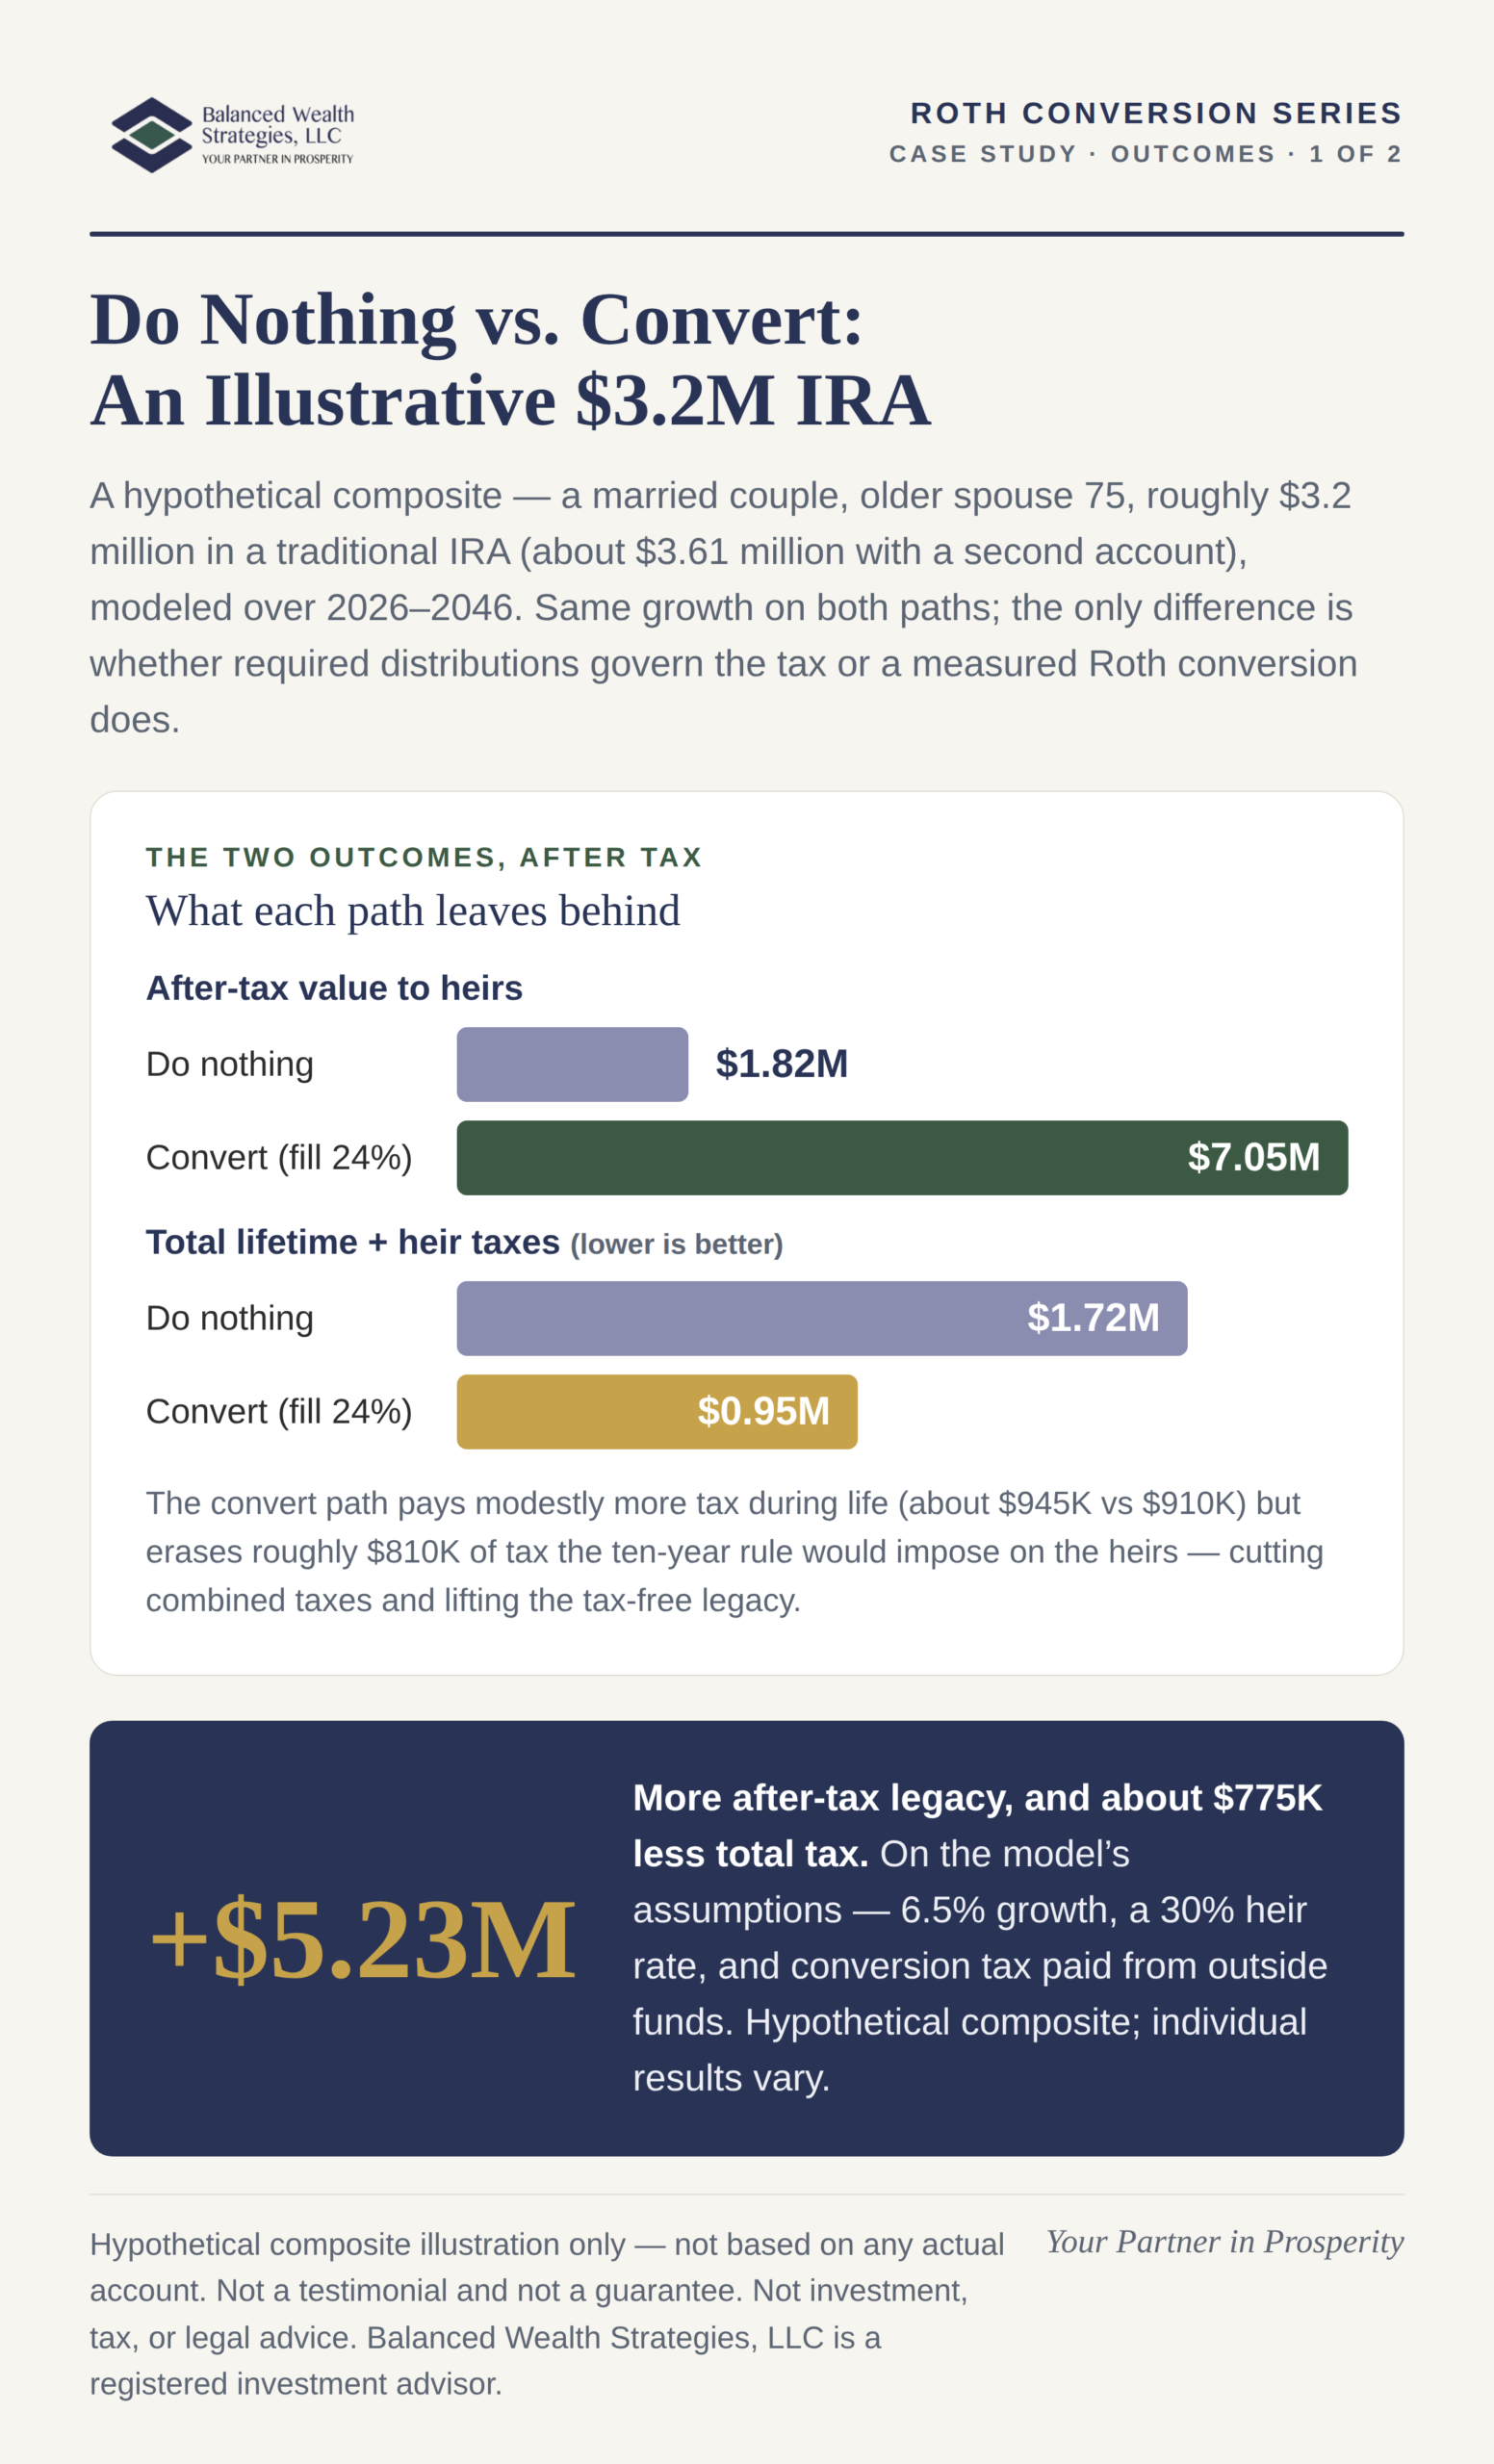
On the same $3.6 million traditional IRA, over the same twenty years and the same growth, two paths diverged almost beyond recognition: one left about $1.8 million to the children after taxes, the other about $7.05 million, entirely tax-free. The difference was not investment return. It was a decision, whether to let required distributions govern the taxation of the account, or to take hold of that tax through a measured, multi-year series of Roth conversions. This illustrative case study ties together the three themes of the series: lifetime tax, the inheritance, and the surviving spouse.
On paper, the two paths began with the very same couple and the very same retirement account. A married couple, both retired, the older spouse aged 75, holding roughly $3.2 million in a traditional IRA in a state with no income tax on the distributions. Twenty years later, the two paths had diverged almost beyond recognition. One left about $1.8 million to the children after taxes. The other left about $7.05 million, entirely tax-free. This case study walks through how that decision was analyzed, and it ties together the three themes of our series: your own lifetime tax, the inheritance your heirs keep, and the position of a surviving spouse.
The Situation
The couple was newly reliant on their portfolio. Consulting income had wound down, and the years immediately ahead were, in all likelihood, the lowest-income years the couple would ever have. Between them they held about $3.2 million in one traditional IRA and a second, smaller IRA of roughly $410,000, a household total near $3.61 million. Filing jointly, in a state that does not tax this income, they faced a purely federal question. A separate decision was already on the table for 2026: a realignment within a taxable investment account expected to generate roughly $16,000 of ordinary income. That realignment came first in the analysis, because it consumed some of the year’s bracket and Medicare headroom before any conversion could be layered on top.
The Problem: The Account That Will Not Shrink
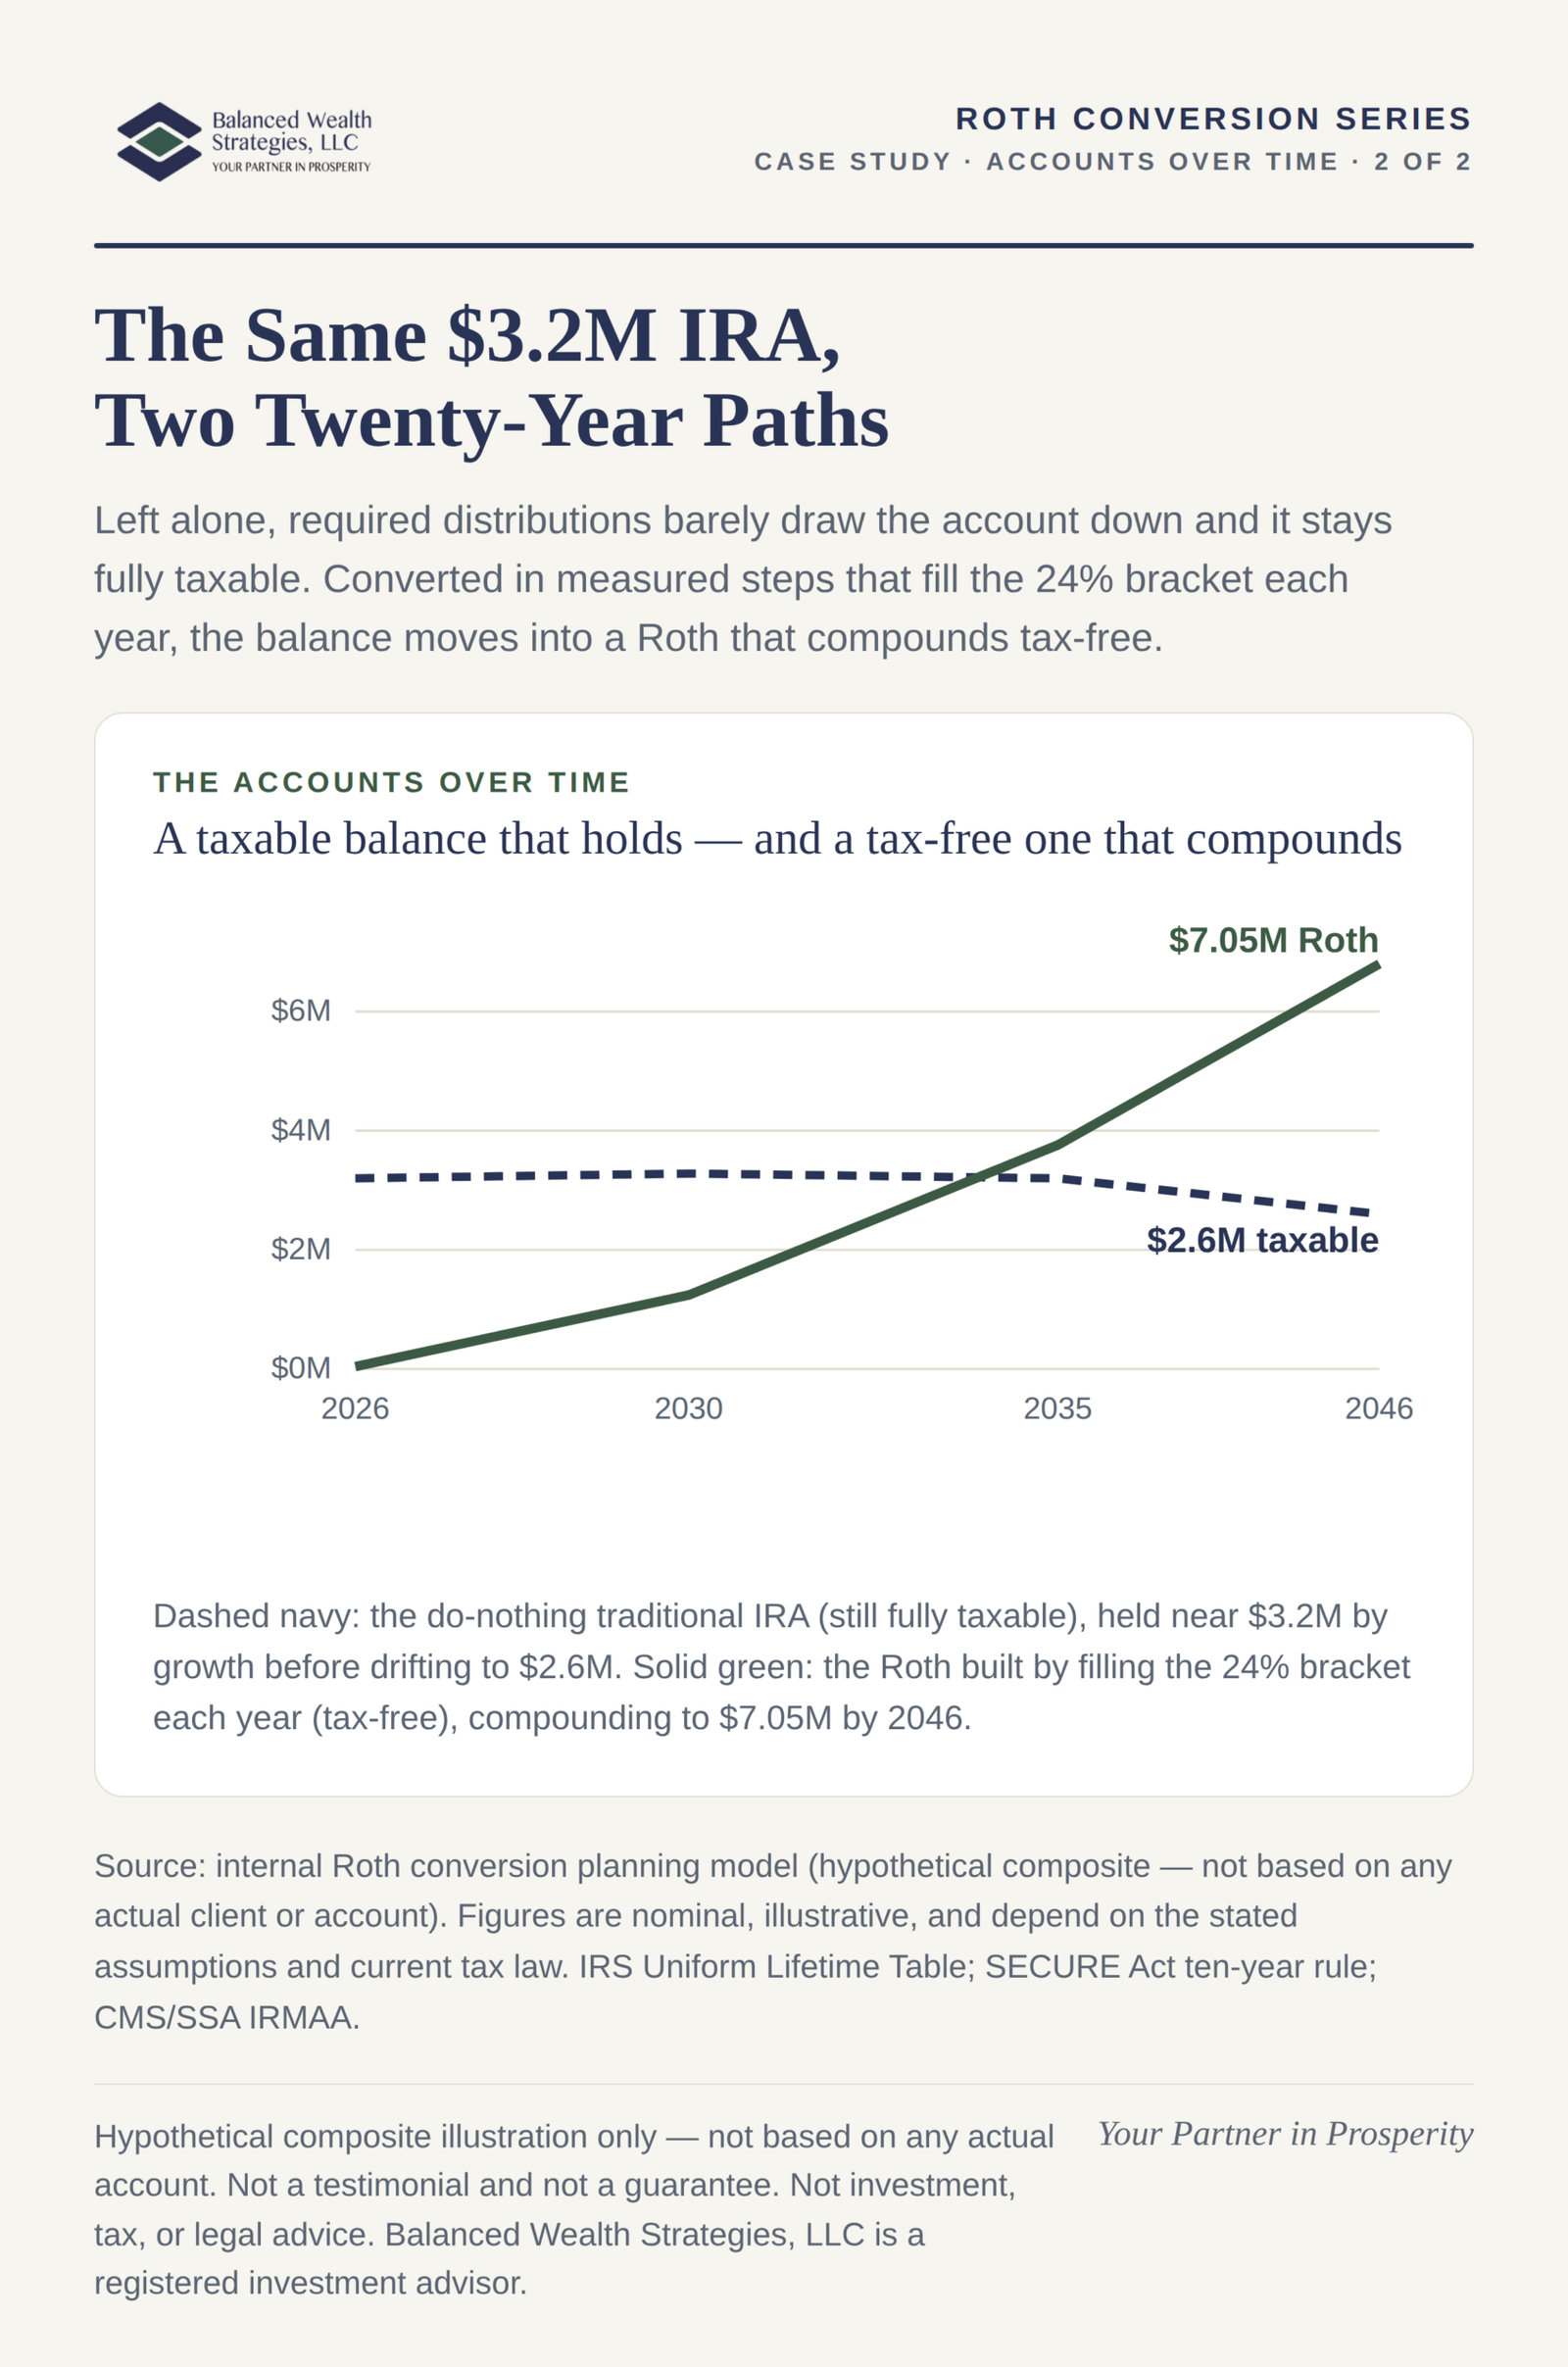
The model’s do-nothing projection made the case for acting. The first required distribution, in 2026, was about $130,000. Under the IRS Uniform Lifetime Table it climbed year after year, past $175,000 by the couple’s mid-eighties and toward $250,000 by age 95, while 6.5 percent growth very nearly replaced each withdrawal. The balance did not fall in any meaningful way for well over a decade; it hovered near $3.2 million and only drifted down to about $2.6 million by 2046. Across the full horizon the couple would take more than $3.8 million in required distributions and still leave a large, fully taxable account behind. Two consequences followed. Those distributions would keep the couple near the 24 percent bracket for the rest of their lives, whether they wanted the income or not; and whatever remained would pass to their children, who as non-spouse beneficiaries must empty an inherited traditional IRA within ten years, at their own rates, stacked on their own peak-earning incomes. The model assumed the children would be in a 30 percent bracket.
The Analysis: Sizing the Conversion Around the Thresholds
The working model sized a 2026 conversion not by the tax bracket alone but by the thresholds that actually govern the cost, the net investment income tax floor and the Medicare (IRMAA) surcharge tiers, which follow a two-year lookback, so a 2026 conversion reaches 2028 premiums. With the $16,000 realignment layered in first, three sensible ceilings emerged, in rising order of tax accepted: a conversion of about $18,000 kept modified income at $250,000, just short of the 3.8 percent net investment income tax, an all-in cost near 23 percent; a conversion of about $42,000 stopped just below the $274,000 second Medicare tier, an all-in cost near 26 percent; and a conversion of about $255,000 filled the 24 percent bracket outright, an all-in cost near 25 percent and far more converted for each dollar of surcharge, though it did carry 2028 Medicare premiums into a higher tier. The model also flagged the stretch to avoid: the tranche that merely crosses a Medicare tier without filling the bracket above it is the most expensive money to convert, because it pays the full surcharge for very little additional conversion. Stop just short of a threshold, or move well past it, but do not stop squarely on top of one.
Worked example (illustrative). The smaller $410,000 IRA was handled as its own clean decision. Because it passes to the children rather than to a surviving spouse, and because it is small, converting it in full over two or three years was inexpensive and removed its required distributions entirely. Paying the tax at the couple’s roughly 22 percent rate rather than leaving it to be taxed later at the children’s assumed 30 percent bracket is $90,200 versus $123,000 on the same $410,000, keeping roughly $32,800 more in the family. The same 8-point rate spread, applied to the far larger main IRA, is what drives the case-study result below. Figures are a hypothetical illustration on the stated assumptions and depend on the reader’s own facts.
The Strategy: Filling the 24 Percent Bracket Each Year
Given the size of the account and the trajectory of the distributions, the model tested a deliberate plan: fill the 24 percent bracket each year, converting roughly $250,000 to $300,000 annually after the required distribution. On that path the traditional IRA drew down steadily as the Roth built, and the bulk of the account moved into the Roth by around 2038. By then the traditional balance approached zero and the Roth continued compounding tax-free from there.
The Outcome, Illustrated: Lifetime and Legacy
| Measure (2026–2046, illustrative) | Do Nothing | Convert (Fill 24%) |
|---|---|---|
| Tax paid during life | ≈ $910,000 | ≈ $945,000 |
| Tax later owed by heirs | ≈ $810,000 | $0 |
| Total lifetime + heir taxes | ≈ $1,720,000 | ≈ $945,000 |
| Ending retirement account (2046) | ≈ $2.6M (taxable) | ≈ $7.05M (tax-free Roth) |
| After-tax value to heirs | ≈ $1.82M | ≈ $7.05M |
The convert path paid only modestly more tax during the couple’s lives, about $945,000 against $910,000, but it erased the roughly $810,000 of deferred tax that the do-nothing path handed to the children. Counting both generations, total taxes fell from about $1.72 million to about $945,000, a difference near $775,000. And because the conversion tax was paid from outside funds, the full amount compounded inside the Roth: the after-tax legacy rose from about $1.82 million to about $7.05 million, an improvement of roughly $5.23 million. Even measured in present-value terms, which compresses distant dollars, the convert path improved both the total tax and the after-tax legacy. None of this reflects an actual result; a different return assumption, a different heir tax bracket, or a change in tax law would change every figure shown.

The Lessons
This single household illustrates all three reasons the series has examined. On lifetime tax, the couple traded a lifetime of rising, uncontrolled required distributions for a deliberate, bracket-filling plan on their own terms. On legacy, they converted a taxable inheritance governed by the ten-year rule into a tax-free one that keeps compounding for their children. And on the survivor, moving income out of the joint-filing years reduces the required distributions that a surviving spouse would otherwise face alone, in single-filer brackets. The figures here are specific to one modeled composite and its assumptions, a 6.5 percent return, a 30 percent heir rate, tax paid from outside funds, and today’s tax law. Change any of those, and the numbers change with them. What does not change is the shape of the opportunity: for a large traditional IRA that required distributions will never exhaust, the question is rarely whether the tax is paid, but who pays it, when, and at what rate.
How to Run This Analysis on Your Own Facts
- Project the do-nothing path. Model required distributions on your accounts and a reasonable return to see whether they ever meaningfully draw the balance down.
- Layer in other income first. Account for any wages, realignments, or other income that consumes bracket and Medicare headroom before a conversion.
- Find the binding thresholds. Identify the NIIT floor and the IRMAA tiers, and size each year’s conversion to stop just short of one or move well past it, never on top.
- Compare rates across generations. Weigh your all-in rate now against your heirs’ likely rate under the ten-year rule; the spread is the prize.
- Pay the tax from outside funds and revisit annually. Preserve the full conversion in the Roth, and re-model as balances, income, and the law change; confirm current-year figures before acting.
If your own retirement accounts raise the same question this illustration explores, schedule a confidential consultation with Mark J. Burger, CPA → to have the numbers modeled on your specific facts. Learn more about Mark J Burger, CPA

- Is this a real client’s results? No. The household is a hypothetical composite and the figures are a simplified illustration generated from a planning model on stated assumptions, not drawn from any actual account. It is offered for education only and is not a testimonial, an endorsement, or a representation that any person achieved these results. Actual outcomes depend on individual facts, future tax law, and market returns, all of which vary.
- Why convert if it means paying more tax during the couples lives? The comparison is not lifetime tax alone but total tax across both generations, plus the after-tax legacy. In this illustration the couple paid modestly more during life, yet erased a far larger deferred tax that the ten-year rule would have imposed on their children, lowering combined taxes and increasing the tax-free inheritance. Whether that trade favors conversion depends on the specific rates involved.
- Why does the size of the conversion stop at particular dollar figures? Because the true cost of a conversion is governed by thresholds, not brackets alone. The net investment income tax floor and the Medicare (IRMAA) surcharge tiers step up at fixed points, and dollars that merely cross a threshold are the most expensive to convert. A sound conversion is sized to stop just short of a costly threshold or to move well past it, rather than landing on top of one.
- Should the tax on a conversion be paid from the IRA or from other funds? As a general educational matter, paying the tax from outside funds lets the entire converted amount compound in the Roth, which is why this illustration assumes it. Paying the tax from the IRA reduces the amount that reaches the Roth and lowers the eventual legacy. The model shows both; the right choice depends on available resources and individual circumstances.
- Does a plan like this make sense for every large IRA? No. The case for conversion is strongest when required distributions cannot exhaust the account, when today’s rates are lower than the rates the owner or heirs would otherwise face, and when outside funds are available for the tax. For smaller accounts, lower expected heir rates, or different cash-flow needs, the analysis can point the other way. Each situation should be modeled on its own facts.
Important Illustration & Case-Study Disclosure
This case study is a hypothetical, illustrative composite prepared from a planning model using assumptions stated in the article, including an assumed rate of return, assumed tax rates, and current tax law. It is not modeled on any specific client or account. The figures do not reflect the actual experience of any person, are not a testimonial or endorsement, and are not a guarantee or prediction of future results. Hypothetical results have inherent limitations and do not represent actual investing or tax outcomes; small changes in the underlying assumptions can produce materially different results. This illustration is not relevant to, and does not reflect, the financial situation, tax bracket, or objectives of any particular reader, and should not be relied upon in making an investment or tax decision. Individual results will vary based on personal circumstances, future changes in tax law, and market performance. Nothing here is individualized investment, tax, or legal advice.
Important Regulatory Disclosure
Balanced Wealth Strategies, LLC is a registered investment advisor. This is not an offer to sell securities or the solicitation of an offer to purchase securities. All investing involves risk, including the potential loss of principal. Past performance is not indicative of future results. Please see our Disclosures for Form ADV Part 2A and 2B for complete details about our services, fees and professional background.
Sources & assumptions: figures are a hypothetical composite generated from an internal Roth conversion planning model, not drawn from any actual client or account: combined traditional IRA approximately $3.2M plus a second approximately $410K IRA; 6.5% assumed annual growth; married filing jointly; no state income tax on the distributions; conversion tax assumed paid from outside funds; horizon 2026-2046 (through age 95); assumed heir marginal rate 30%. IRS Uniform Lifetime Table and RMD rules (Publication 590-B); required beginning age 73 under SECURE 2.0. 2026 federal brackets (MFJ) and thresholds; NIIT under IRC section 1411; 2026 Medicare IRMAA thresholds (CMS/SSA), two-year lookback; SECURE Act ten-year rule and 2024 final regulations. Figures are nominal unless described as present value; rates shown are single-rate proxies for a multi-bracket reality. This is a directional planning illustration, not a tax return, a performance record, or an investment recommendation, and actual results for any real household will differ.